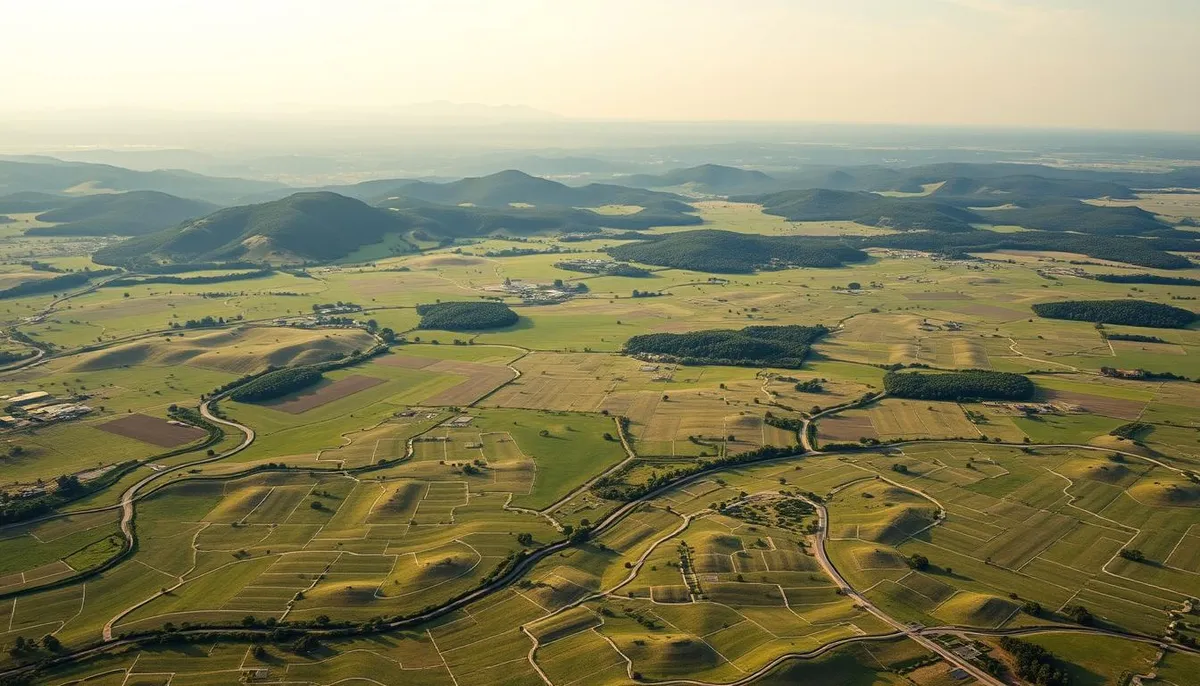
Do you know this tool that maps French agriculture with unmatched precision? The Graphical Parcel Register offers a detailed view of arable land at a scale of 1/5000. Imagine: each cultural plot, each parcel declared under the Common Agricultural Policy (CAP) becomes a centerpiece of a complex… yet accessible system!
Since 2015, this system has transformed agricultural data management. It allows for tracking the evolution of practices while ensuring exceptional traceability. Farmers, researchers, and public decision-makers find concrete answers to support the transition towards sustainable agriculture.
How does this high-precision mapping work? It relies on meticulous territorial division where each farm becomes a key player. CAP declarations constantly feed this living database, creating a true digital ecosystem.
This geographical "role-playing" goes beyond simple administration. It shapes European agricultural policies and directly influences our daily lives. Ready to explore the behind-the-scenes of this silent revolution?
Discovery and Context
Behind every field declared for European aid lies a mapping revolution. This unique system has transformed agricultural practices since 2015 by combining technology and transparency.
Origin and Stakes of the RPG
The graphical parcel register was born from a crucial need: to modernize the tracking of arable land. Before its existence, manual declarations created errors and delays. Today, farmers report their parcels with an accuracy of 5 meters!
- Ensure fairness in the allocation of CAP aids
- Track the evolution of crops over 10 years
- Prevent environmental risks
Role of the Graphical Parcel Register
This system serves as the backbone of French agriculture. The data collected feeds:
| Aspect | Before 2015 | After 2015 |
|---|---|---|
| Precision | 1/25,000 | 1/5,000 |
| Update | Annual | Quarterly |
| Users | 5,000 | 450,000 |
The farmers become actors in this graphical parcel database. Their declarations shape agricultural policies while protecting ecosystems. A true virtuous circle!
Glossary of the RPG Crop Code
Did you know that each agricultural code hides a complex classification system? Let’s dive into the workings of this nomenclature that structures 28 crop groups. These categories determine everything: from European aids to sustainable practices.
Definitions and Essential Terms
The language of farmers resembles a secret alphabet. Take the example of BH: three letters that designate winter soft wheat. Each code combines:
- A main letter (B for wheat)
- A precise suffix (H for winter, P for spring)
This logic applies to the 150+ listed varieties. The declarations even use specific codes for uncultivated areas (GEL) or permanent pastures.
The Crop Groups and Their Classification
The 28 groups serve as the basis for national statistical analysis. Let’s compare three key categories:
| Group | Typical Crops | Representative Codes |
|---|---|---|
| Cereals | Wheat, barley, grain corn | BH, OP, MA |
| Oilseeds | Rapeseed, sunflower | CH, TO |
| Specialized | Vines, fruit trees | VI, AR |
Cereals dominate with 12 subcategories, from the classics (soft wheat) to the lesser-known (triticale). A crucial detail: the same group can include both annual and perennial crops to simplify analyses.
Data Analysis and RPG Files
Did you know that each agricultural parcel generates valuable data? This structured information allows us to decipher the evolution of territories and agricultural practices. Let’s see how to transform these technical files into actionable knowledge.
Exploring Formats and Their Potential
The data from the register comes in three key formats:
| Format | Usage | Advantage |
|---|---|---|
| .shp/.gpkg | Geometry of parcels | Precision to the nearest meter |
| .xlsx | Attribute tables | Cross-referencing information |
| CSV | Simplified export | Universal compatibility |
The .gpkg files integrate up to 50 layers of information: administrative boundaries, types of crops, environmental commitments. A goldmine for cartographers!
From Collection to Operational Use
Integrating the cultivated areas into a GIS requires a rigorous methodology. Here are the key steps:
- Verification of coordinate systems (RGF93)
- Joining spatial data and attribute tables
- Quality control through successive versions (2015-2023)
MAEC/BIO measures appear in 12 specific fields, allowing us to trace each hectare engaged in sustainable practices. A concrete example? The code ‘PRC_23’ identifies pastures with high ecological value.
Conclusion
This tool has redefined our understanding of agricultural land. By tracking crops and frozen areas day by day, it offers a living snapshot of our countryside. Farmers find concrete benchmarks to adapt their practices. In this geek universe, advanced technologies play a key role in optimizing agricultural resources.
The strength of this system? Transforming millions of data points into informed decisions. The parcels become units of analysis, each type of production revealing its specificities. Environmental measures rely on this dynamic mapping.
Tomorrow, this digital page will continue to evolve. It will integrate new indicators on land use or water consumption. A crucial step to reconcile grain yields and ecosystem preservation.
In the face of climate challenges, these technologies show the way. They prove that high-performing agriculture can also be virtuous. It’s up to us to work collectively to maximize the benefits!